FermenterTool
This software can be helpful for the manufacturers which use the following fermentation processes:
- algae and yeasts
- biofuel, antibiotics and bacteriocins
- probiotics
- vaccines
- organic acids and alcohols
- citric, acetic, propionic acids
- recombinant products
- proteins, lipids, polysaccharides, nucleotids
- brewing, enzymes, amino acids, vitamines
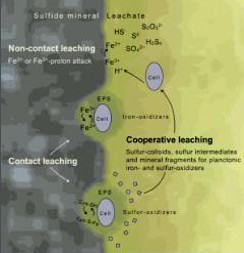
- Leaching of metals from ores
1. Biomass for technical purposes and its products:
Algae, fungi, plants, yeasts, bacteria, biofuel, proteins, lipids, polysaccharides, other biopolymers


2. Simple organic substances:
organic acids and alcohols, etc. citric, acetic, propionic acids, amino acids, biogas


4. Medicine, veterinary medicine
probiotics, vaccines, cell lines, steroids, antibiotics and bacteriocins


7. Leaching of metals from ores:
bacterial leaching of metals from ores.
http://www.scielo.org.za/pdf/jsaimm/v112n12/13.pdf


Curves for biomass growth and products/substrates accumulation
We applied our equations to describe a large variety of processes with S-like biomass growth curves, as well as to describe concentrations of substances in closed systems. So far we are getting remarkable agreement between the experiment and the model, moreover our model specify possible improvements, which makes it quite useful. To prove the concept this approach was used in numerous experiments to increase the protein production by genetically modified microorganisms. We think that our equations describe particularly well GIP phase, which is certainly a new word in the theory of fermentation processes.
We think that this model can be quite helpful for most people involved in fermentation technologies and we decided to make it available as a Web-service capable to process individual data sets. At this point the Web-service is running in test mode, and in October we plan to switch to production mode. We plan to make the service available to a larger audience charging a small fee needed to maintain and to improve the system.
We would like to personally invite you to be the first user of the system!
You will be able to:
- test your own data
- get results and forecasts about possible improvements within 1-2 working days by email (this period will be almost instant in production mode)
- view the details of analysis, plots and values of parameters on your personal page
- get technological recommendations about your fermentation process and discuss details of possible improvements with our qualified specialists.
The software allows you to process data for 2 cases:
- biomass only
- biomass + several substrates + several products. (up to 10 substrates or products)
To prepare your data for processing please organize your data in excel table in the following table. Please, note that the data for the biomass should look like as a S-shaped curve. Also for effective processing the software needs minimal number of Biomass measurements n>8.
| N | Time of the process τ | Products / substrates concentrations P/S, units 1 | Biomass concentrations X, units |
|---|---|---|---|
| 1 | 0 | Χ0 | P0 or/and S0 |
| 2 | τ1 | Χ1 | P1 or/and S1 |
| 3 | τ2 | Χ2 | P2 or/and S2 |
| ... | τ... | Χ... | P...or/and S... |
| n | τn−1 | Χn−1 | Pn−1 or/and Sn−1 |
Graphs
We offer a new tool for the analysis and control of fermentation processes. This is the main answer to the question "what is this". You and/or collegues can do these procedures quickly to achieve maximum economic efficiency for the fermentation processes.
Also, you can see below some examples. The main idea lies in the following: We assume that metabolites are synthesized only by proliferating cells. Nonproliferating cells, as a rule, destroy these products. Therefore, signs of the constants for metabolite synthesis and degradation are opposite. The same should be stated for substrates utilized for cell construction. We always see the product as a result of only the "positive" with kdiv constant synthesis processes.
But, it is known as "negative" with kst constant processes also always occur. It is the destruction of the product, preventing its syntheses with any unknown reasons, etc. The same can be said about the utilization of substrates...
This tool makes it possible to calculate the "positive" and "negative" processes to minimize the impact of the latter. First, we do "ordinary" processes and they are subject to analysis and prediction if we will assume, that kst = 0.
Then, the conditions for this kst = 0 must be found (also using our instrument). Thus, these conditions will be our recommendations. The last step is the practical implementation of our recommendations.
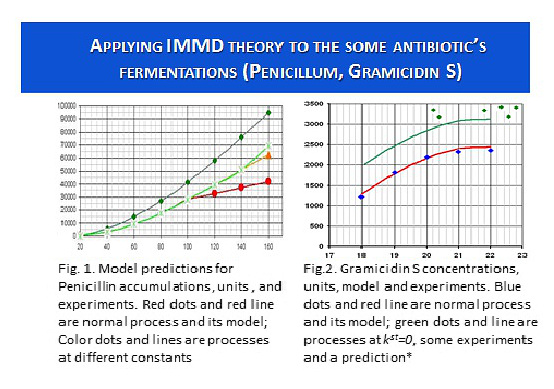
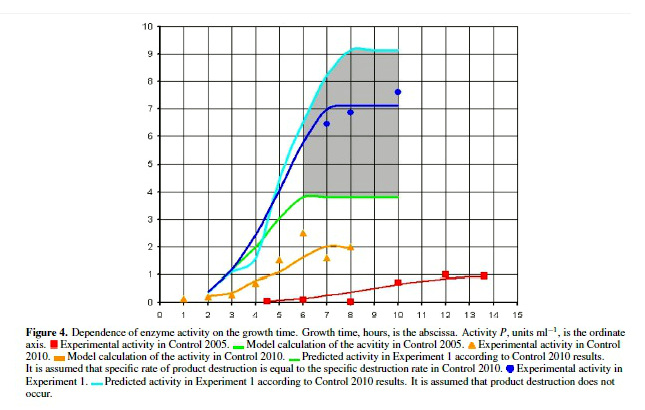
You can see the results for the recombinant Metalloproteinase and for antibiotics Gramicidin S and Penicillin (Fig.1, 2, 3). As it can be seen, the end results are the same with the calculated predictions.
The similar pattern is observed for all the processes that are described by S- shaped curves. In the same way a study of evolutionary processes was done.

Fig.2. Gramicidin S concentrations, units, model and experiments.


